
The effects of ninety minutes per week of moderate intensity aerobic exercise on metabolic health in individuals with Type 2 Diabetes: A pilot study
Vagner R. R. Silva1#, Felipe L. Belozo1#, Rodrigo M. Pereira1, Carlos K. Katashima1, Andre V. Cordeiro1, Jean F. Alves2, Jose R. Pauli1, Adelino Silva3,4, Eduardo R. Ropelle1, Leandro P. De Moura1*
1Department of Sport Sciences, School of Applied Science, University of Campinas (UNICAMP), Limeira, Sao Paulo, Brazil
2Department of Biochemistry, Faculty of Biology, University of Campinas (UNICAMP), Campinas, Sao Paulo, Brazil
3Postgraduate Program in Rehabilitation and Functional Performance, Ribeirao Preto Medical School, USP, Ribeirao Preto, SP, Brazil
4School of Physical Education and Sport of Ribeirao Preto, University of Sao Paulo, Ribeirao Preto, SP, Brazil
5School of Physical Education and Sport of Ribeirao Preto, University of Sao Paulo (USP), Ribeirao Preto, SP, Brazil
Abstract
Sedentary lifestyle is one of the main factors that contribute to the development of diabetes. The amount recommended, in order to achieve an improved overall metabolic health, is at least 150 minutes of moderate-intensity exercise weekly. However, due to the high volume prescribed, the adherence to this practice is not as good as expected, thereby increasing the incidence of sedentary lifestyle and diabetes. Here, we show the impact of reducing the recommended amount of exercise by 40% (90 minutes/week) on cholesterolemia and glycemia among diabetic individuals. 13 diabetics (men and women), divided into two groups: untrained (n=6) and trained (n=7) (mean age 45.3±3.9). The trained group was submitted to the practice of aerobic exercise on a treadmill, three times a week (70–80% MHR), for 30 min/day, for 8 weeks. Subsequently, were analysed glucose levels, glycated hemoglobin A1C (HbA1c), total cholesterol and its fraction (LDL-c, VLDL-c, HDL-c) and total triglycerides (TG). Ninety minutes per week of moderate-intensity exercise was effective in controlling blood cholesterol by reducing the total cholesterol and LDL-c fraction. Furthermore, it was observed that this amount of exercise promoted a reduction in hyperglycemia from the first session until the end of the experiment. Fasting glycemia was reduced after the fourth week of training, even without changes in the adiposity. In conclusion, 90 minutes of moderate intensity exercise a week, spread over 3 nonconsecutive days of 30 minutes of exercise, can improve the lipid profile and glucose homeostasis in diabetic patients, even without a reduction of adiposity.
This study was registered under ClinicalTrials.gov with the identifier code number: RBR-8mwkyq
Introduction
Physical inactivity is a major cause of death worldwide1. According to the Centers for Disease Control and Prevention, from the second half of twentieth century non-communicable chronic diseases, such as cardiovascular disease, cancer, nonalcoholic fatty liver and diabetes, became the first cause of mortality2. One of these noncommunicable chronic diseases, triggered by inactivity, is type 2 diabetes mellitus (T2DM). About 451 million people with T2DM around the world and prevalence will increase to 693 million in 2045. Also, the International Diabetes Federation estimated that 49.7% of the people have diabetes but are undiagnosed3.
T2DM is characterized by resistance to the action of the hormone insulin, initially characterized by hyperinsulinemia. The perpetuation of this state leads to an increase of glycemia and triggers several consequences for health, in particular the formation of Advanced Glycation End-product (AGEs), hypertriglyceridemia, dyslipidemia, cholesterolemia and an increase of LDL-c4. Consequently, it is essential to establish strategies to reduce the impact of hyperglycemia on the health of diabetics. The high number of diabetics is directly related to the high number of sedentary people. In 2013, 8.3% of the world population (382 million people) was diagnosed as being diabetic, and in 2012 and 2013, 1.5 to 5.1 million people died as a result of this disease, making this condition the 8th biggest cause of death in the world. By the year 2035, it is estimated that 592 million people will have died from chronic hyperglycemia5,6.
It is very well known that regular physical exercise promotes increased glucose uptake by muscle tissue and inhibits hepatic gluconeogenesis; thus, this practice is an important tool in the control of blood glucose7,8. According to the American College of Sports Medicine (ACSM) and the American Diabetes Association (ADA), it is recommended for individuals with T2DM minimal 150 minutes per week of moderate (50%-70% of an individual’s maximum heart rate (MHR)) or vigorous physical activity (>70% of an individual’s MHR) in order to obtain total health benefits and healthy weight and cannot have long intervals between the sessions (more than 2 days between workouts)9. Also, multicomponent exercise should be included into the session of exercise such as resistance training, flexibility among others10,11.
Unfortunately, because of the amount of exercise required, these guidelines are challenging, since this level of physical exercise and its adherence remains low worldwide1. Thus, there is a clear need to develop training protocols that enable diabetic people, regardless of age, sex, body weight or fitness level, to perform exercises often to control glycemia12. It was recently shown that a drastic reduction in exercise volume accompanied by increased exercise intensity is sufficient to obtain similar results to those found after long-term exercise in terms of aerobic metabolism and energy homeostasis control12,13. In this context, since much of the population does not have the available time to perform physical exercise, this study aimed to reduce the training volume by 40% proposed by the ACSM9 and assess the impact of 3 nonconsecutive days (30 min / day) of moderate-intensity exercise and check if the reduction of the training volume can improve the serum chemistry profile, complete blood count characteristics and glycemic control in diabetic individuals.
Methods
Participants
Forty six patients were recruited from Unity Health Center II in the city of Sumaré, Sao Paulo/Brazil. Fourteen patients were eligible to participate in the study and thirteen completed all the experimental procedures (Figure 1). Firstly, similar to other’s studies from our laboratory and the work of Dantas and colleagues14, a prior sample size calculation was utilized, indicating that at least 7 participants were required, based on an α level established at 0.05 of significance. Therefore, thirteen patients were divided into two groups, randomly assigned, with six in the untrained groups (3 males and 3 females) and seven in the trained groups (3 males and 4 females), with an age range of 40 to 55 years old. The exercised group was authorized for medical clinic to practice exercise. To be included in the study, patients had to be voluntary, overweight (body mass index = above 25 kg/m²), sedentary and diagnosed with T2DM. The criteria adopted for the sedentary condition were to practice less than 150 minutes of moderate physical activity per week15.
For this, all participants had to present blood glucose equal to or above 130 mg/dL, not be participating in another study, not be performing exercise regularly and be overweight. Because they were diabetic, seven participants were taking Metformin or Glycemin. Four of the evaluated patients were diagnosed with hypertension, which was clinically controlled by taking hypotensive drugs, such as: Captopril, Furosemide or Enalapril. Five patients had SBP (systolic blood pressure) above 139 mmHg and DBP (diastolic blood pressure) above 89 mmHg. The criterion for exclusion from the program was the absence from training sessions or any pre-scheduled evaluation.
Ethical approval
The study was conducted in accordance with the guidelines of the University of Campinas for clinical trials. All participants invited onto the program, after the stages and procedures for the research protocols being explained, signed an informed consent form, which was approved by the university’s Ethics Committee (protocol number: 722/2010), following all the ethical research standards that resolution 196/96 recommends and was registered in the Brazilian Clinical Trials Registry (ReBec) (Register Number: RBR-8mwkyq) such as a no blindness, clinical trial of prevention, open and single group, an appropriate registry according to the World Health Association (WHO). The authors confirm that all of the experimental protocols were approved by the University of Campinas (UNICAMP).
Evaluated Parameters and Biochemical parameters
Body weight and height were measured at the baseline and Week 8 assessment for all participants and they were weighted during each exercise session for the intervention group. Body Mass Index (BMI) was calculated using the Quetelet formula (body weight divided by height squared). Waist-to-hip ratio (WHR) was measured in the first and after the last week (8th week) of the experiment for both groups. Heart rate (HR) was measured using a cardiac frequency Polar® CS100 model for intensity control; it was evaluated during all 24 exercise sessions. Glucose level was analysed before, during and after each of the 24 physical exercise sessions (5min before exercise; 15min during exercised and 15min after finishing) and it was measured using a portable OneTouch Ultra® tagmonitor. The blood collections were made removing a drop of blood from the finger with a disposable needle using basic safety procedures before the first exercise session (session number 1) and after the last session (session number 24). For the biochemical analyses (related to table 1 and Figure 3), the blood from each participant in both groups was collected after 12 hours of fasting.
Experimental Design
For this experiment, a physical training program of aerobic exercise, with three weekly nonconsecutive sessions, lasting 30 minutes each, was prepared. There was an interval of 48 hours between each session and all sessions took place in the morning. The training protocol consisted of 30 minutes of exercise on a treadmill (Moviment® model RT-400 PRO), performed 3 times a week for eight weeks, making a total of 24 sessions of moderate exercise at the end of the experiment. Each exercise session comprised a 30-minute walk with an established intensity of between 70 and 80 % of MHR. The calculation to find the MHR percentage was based on a mathematical prediction protocol adjusted for age (220 - age)16. The participants were adviced to stop the exercise any time if they feel any discomfort. All exercise sessions were performed in the morning after each participant had consumed their usual breakfast at a predetermined time. In order not to have the bias of the intervention of medication and or food intake, no changes in the medicine and food consumption were suggested for both groups (trained or untrained control group). Also, all participants were informed every week to do not performing any type of exercise during the rest period. According to “The American College of Sports Medicine and the American Diabetes Association” patients with blood glucose levels higher than or equal to 300 mg/dl need more attention during the physical activity11. Thus, thinking in not to create a risk to the participant, patients with blood glucose levels higher than or equal to 300 mg/dl did not perform physical activity. All participants had a warm-up and the cool-down period and they performed the exercise sessions at the same time, which were scheduled in advance. All experimental procedures can be observed in the experimental design illustration in Supplementary Figure 1.
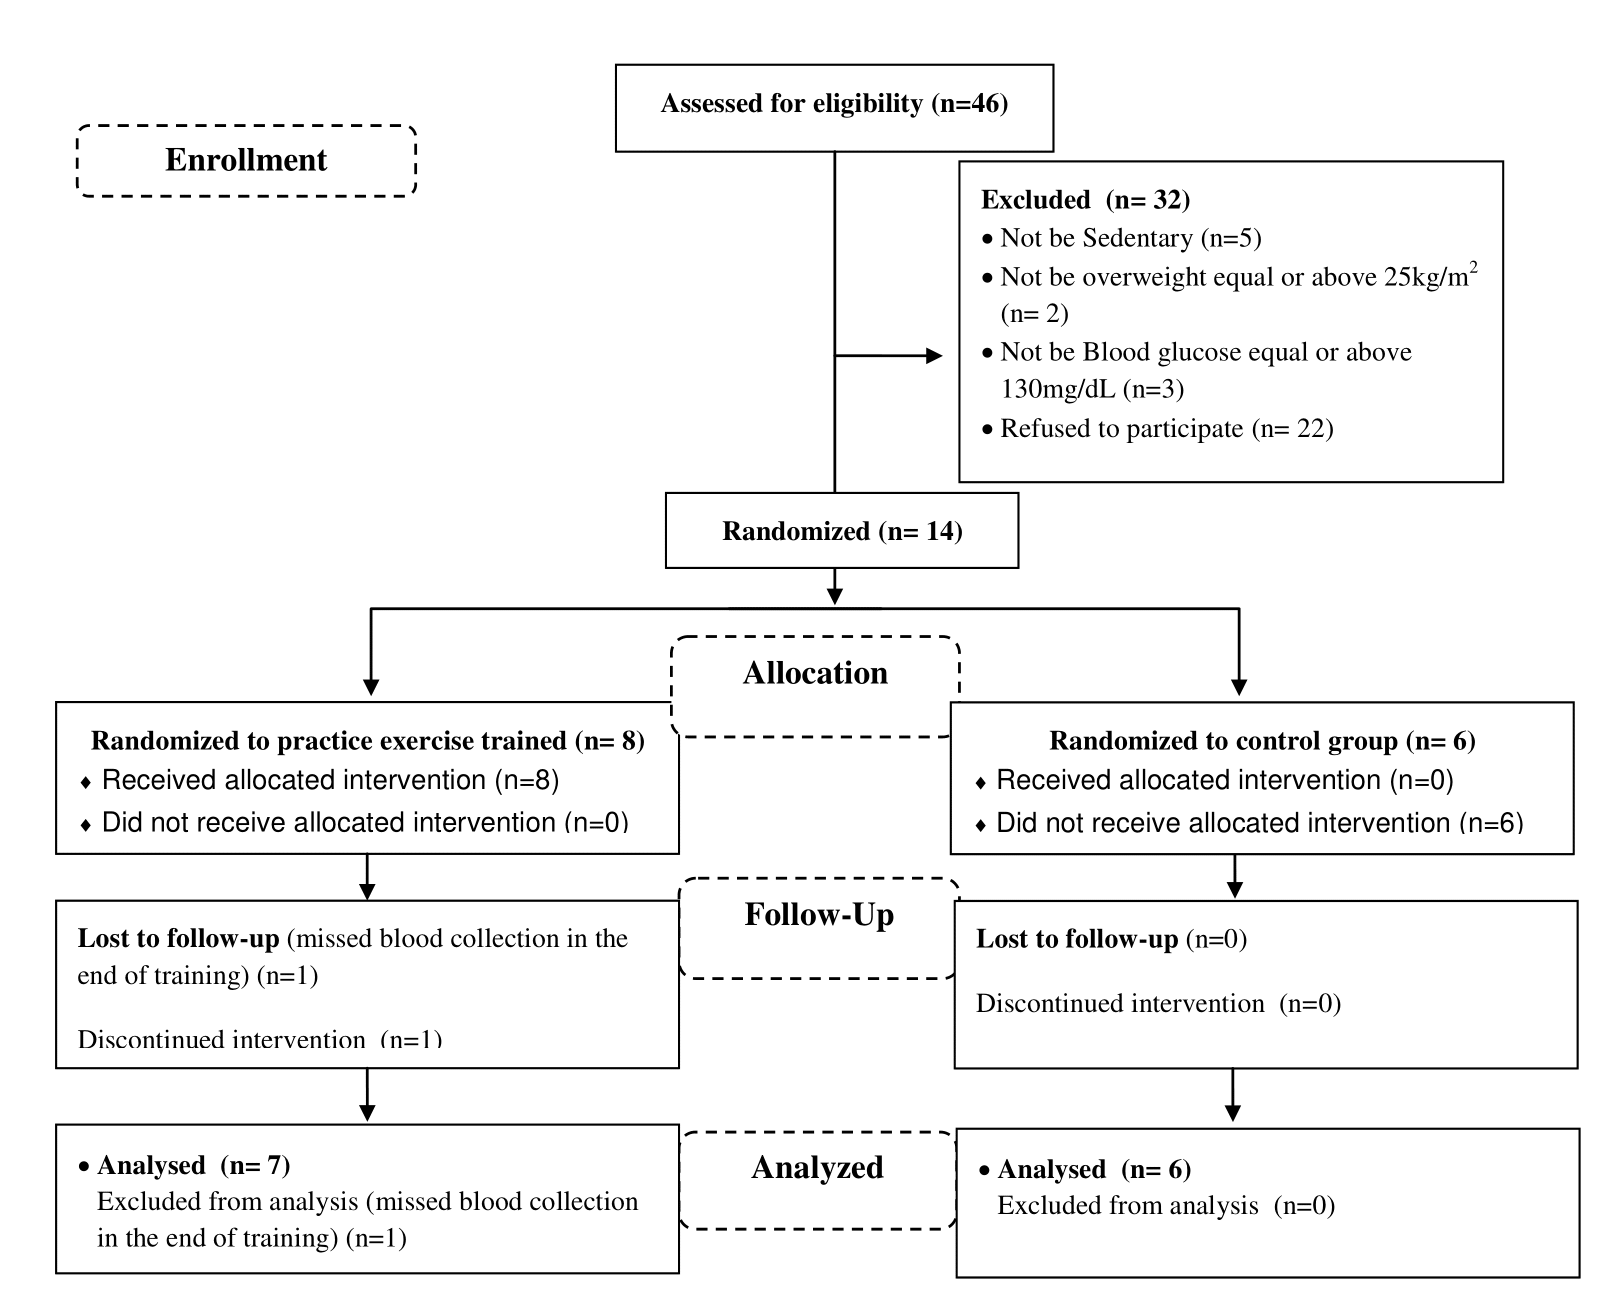
Figure 1. CONSORT diagram for trial.
Statistical Analysis
The distribution of data was previously verified by Bartlett’s test for equal variances, and the data are presented as mean and standard deviation (SD). The analysis was performed using Statistic version 6.0 or GraphPad Prism software test. When necessary were performed using the Student’s t-test, one-way or two-way ANOVA with repeated measures, and subsequently the Bonferroni post hoc test was used. P lower than or equal to 0.05 was considered statistically significant.
Results
Initially, the anthropometric profiles of all participants were analyzed. For demographic profiles, male and female participants, aged 40–55 years, were analyzed (Supplementary Table 1). Comparative analyses were performed between the first and eighth week of training. There was no statistical difference in the body weight, BMI, waist, hip and waist-to-hip ratio of the participants (Supplementary Table 1). However, when assessing the slope of the curve related to weight gain, it was observed from the inclination of the body weight evolution curve (k) that at the end of the experimental period, the trained group had a body weight decay rate of about 0.002%. This decay was not significant, but if this protocol lasted longer, it could lead to a possible change in body composition (Supplementary Figure 2). On the other hand, due to the fact that no changes in body weight were found, it is important to demonstrate the exact effects of exercise on body composition.
The concentrations of HbA1c, total cholesterol and its fractions (VLDL-c, LDL-c and HDL-c) and TG were assessed before and after the exercise protocol in a fasting condition. At baseline, no difference was observed in these parameters for both groups (Table 1). On the other hand, was found a reduction on LDL-c fraction into the untrained control group when compared to the baseline (Table 1). At the end of the 8 weeks of training, even without changes in body weight and HbA1c, it was observed that the training group (which performed 90 minutes of aerobic exercise a week) decreased their total cholesterol by 20% and LDL-c by 30% and thus showed lower cholesterolemia in the last week of training (Table 1). Also, it was observed that the trained group showed a reduction of the fasting glucose comparing the baseline analysis. The untrained group showed no differences in the fasting glucose values throughout the experiment, comparing the baseline analysis (data collected before the first exercise session) with the data collected after the last exercise session (Table 1).
During the training, when the trained group was evaluated, firstly it was observed that the blood glucose concentration was decreased during and after all 24 exercise sessions, comparing baseline (rest period) with the data of the same day (Figure 2A). Also, was noticed a significant reduction in blood glucose in the (S) S6, S8, S9, S11, S12, S14, S15, S17, S19, S23 and S24 sessions when compared to glucose analysis performed in the basal condition (Figure 2D). Furthermore, it was observed that there was a reduction in glycemia when compared to the S8 and S21 sessions (Figure 2B). We also found the same reduction in blood glucose levels during the exercise session in the S8, S9, S11, S21, S23 and S24 sessions (Figure 2C). Also, the analyses of fasting glucose showed that the trained group reduced the glycaemia when compared to the baseline point and also after comparing the trained participants with untrained (Figure 3). The area under the blood glucose curve each time (before, during and after) was analyzed and no difference was found (data not shown). Further, after comparing the effect of only 40% of exercise recommended volume between untrained and trained individuals, it was observed that the trained group showed lower blood glucose compared to the untrained group. Thus, demonstrating the effectiveness of the proposed training protocol controlling glycemia of diabetic participants, even without reduction of body weight (Figure 3).
Table 1. Biochemical characteristics of Untrained and Trained groups. The distribution of data was previously verified by Bartlett’s test for equal variances, and the data are presented as mean and standard deviation (SD).
|
|
Untrained group (n=6) |
Trained group (n=7) |
||||
|
Before |
After 8 Weeks |
P value |
Before |
After 8 Weeks |
P value |
|
|
HbA1c (%) |
7.5±2.0 |
8.3±3.2 |
0.311 |
5.8±1.4 |
5.2±1 |
0.214 |
|
Total Cholesterol (mg/dL) |
254.8±54.1 |
203.7±45.5 |
0.053 |
195.7±18.7 |
159.4±19.8 |
0.002* |
|
LDL-c (mg/dL) |
161.7±50.9 |
110.5±40.4 |
0.041* |
112.3±22.2 |
78.7±11.3 |
0.002* |
|
HDL-c (mg/dL) |
56.5±8.7 |
53.0±12.0 |
0.288 |
57.7±12.3 |
59.6±8.0 |
0.372 |
|
VLDL-c (mg/dL) |
36.7±14.8 |
39.2±13.5 |
0.383 |
25.7±19.1 |
20.3±7.4 |
0.250 |
|
TG (mg/dL) |
183.3±74.2 |
198.0±67.2 |
0.363 |
128.4±95.3 |
102.9±37.3 |
0.261 |
|
Glycemia (mg/dL) |
198.2±80.3 |
169.2±50.9 |
0.1419 |
136.0±32 |
104.1. ±21 |
0.046* |
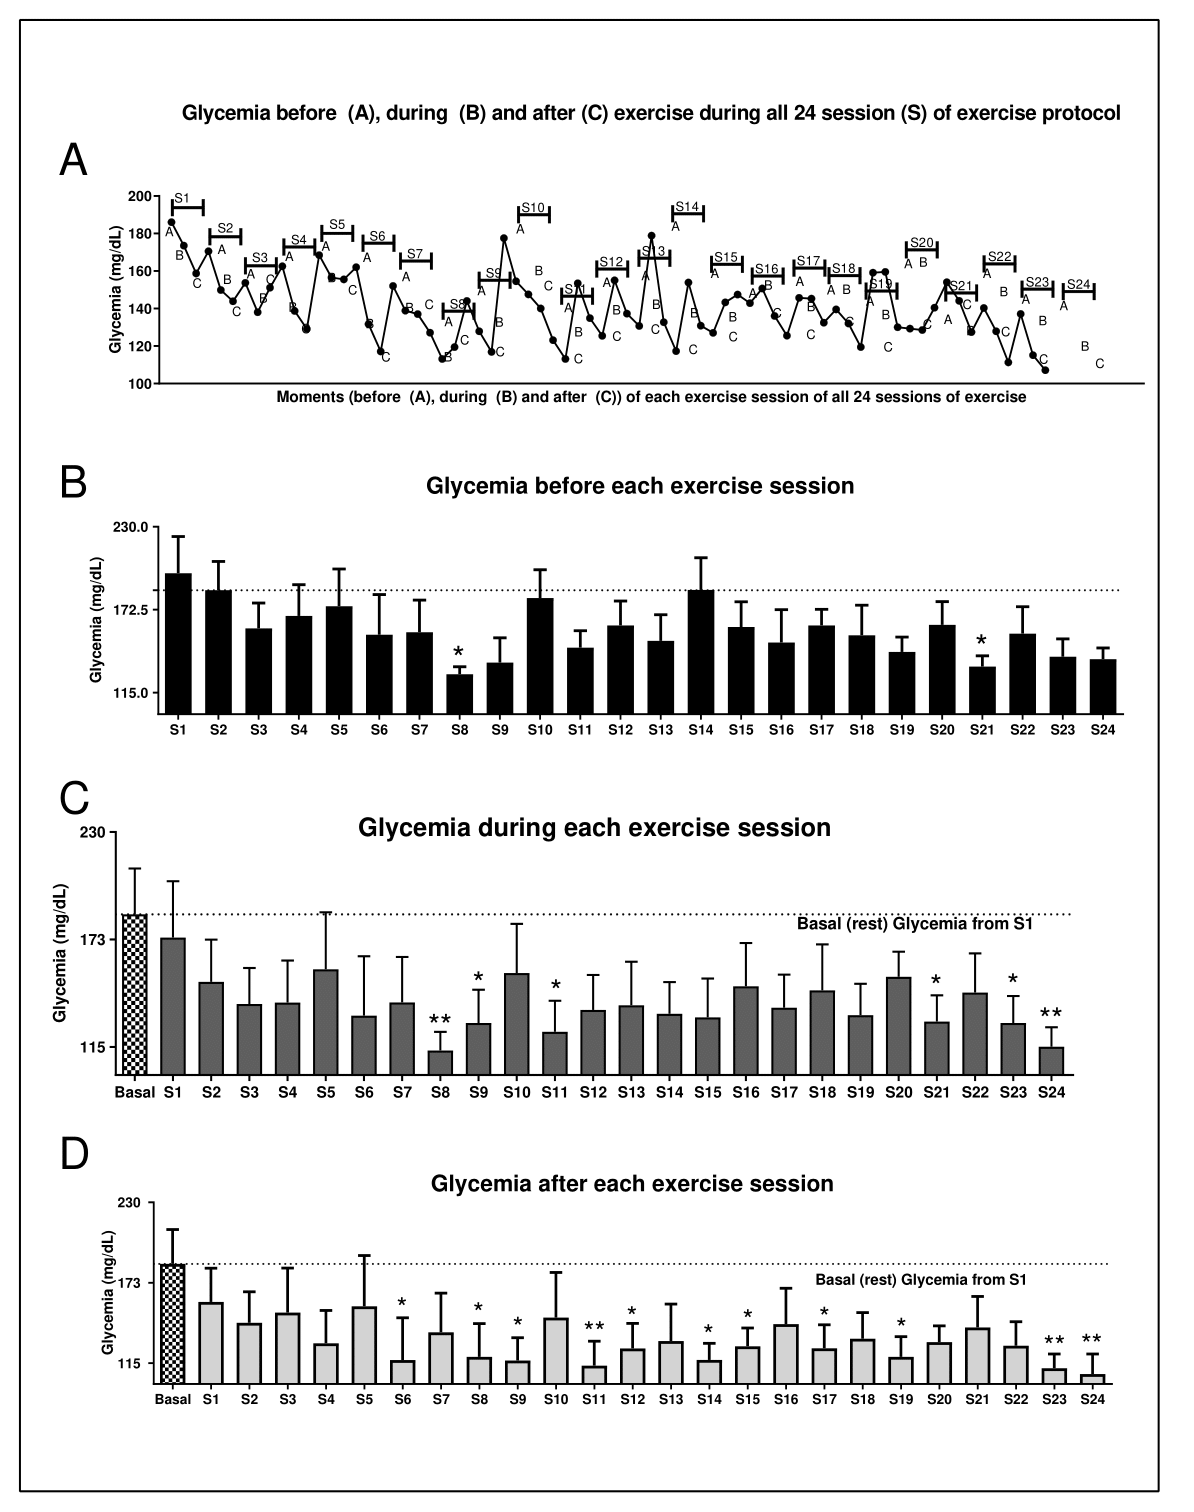
Figure 2. Effects of exercise on glucose levels. (A) Figure A shows the glucose curve throughout the experiment and before starting the exercise session (15 min before in rest state) (a), during the exercise (15 min after starting the exercise) (b) and after each exercise session (15 min after exercise session) (c). S = session. The others show the glucose levels before (B), during (C) and after (D) physical exercise. In graphics c and d there are two comparisons; both of these are being compared with basal glycemia (the first glycemia analyzed in the experiment, before starting the first exercise session). Data were expressed using two-way ANOVA as mean ± S.E.M. using p<0.05. *means different from basal or the first (S1) session of glycemia level.
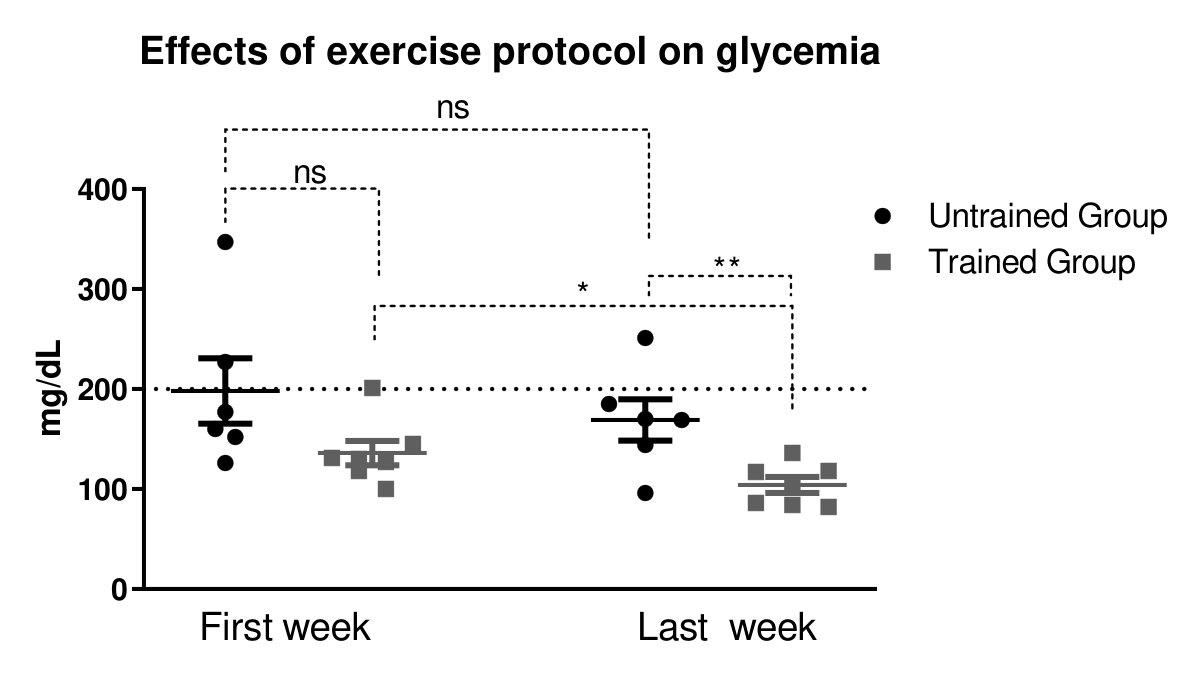
Figure 3. Effect of exercise protocol in glycaemia. Comparative between first week with the last week. *<0.05 vs. untrained group. Data were expressed using Student’s t-test as mean ± S.E.M. using p<0.05. *means.
Discussion
Since the number of cases of T2DM is currently reaching alarming rates, it is very important to investigate more suitable exercise practices for the population in order to promote health benefits for diabetic patients. Important guidelines postulate that the beneficial effects of exercise are found from 150 minutes of moderate exercise per week, divided into 5 sessions of 30 minutes, without exceeding intervals of more than 48 hours between each activity session.
Knowing that a huge proportion of the population does not exercise because of the time it takes7, this study, in an attempt to increase the adherence of the diabetic population to regular physical exercise, proposed to reduce by 40% of the exercise volume suggested and to evaluate 90 minutes of aerobic training per week and assess its effects on the glucose homeostasis, lipid profile, blood count and anthropometric profile of diabetic T2DM patients. From these results, we showed that 90 minutes of aerobic training per week, divided into 3 sets of 30 min/d for 8 weeks, reduces fasting hyperglycemia, total cholesterol and LDL-c. Thus, we provide evidence that shorter exercise protocols can be effective in the treatment of disorders associated with T2DM.
Initially, participants were asked to perform 40% of the exercise amount proposed by the editorial board, divided into three weekly sessions of 30 min/d for 8 weeks. At the end of the experimental protocol, body composition was assessed and no exercise effect was verified. However, when assessing the behavior of the curve related to body weight, we observed a low probability of achieving a reduction in body mass if the experimental protocol training was extended.
It’s known that reduced adiposity can delay the diabetes progression17. Some studies have reported that weight-loss around 5% per year improve the glycaemia in obese people17,18. The fact that the individuals did not show a reduction in body weight can be explained, in part, by the low volume and intensity of training and because there was no interference in the eating habits of the individuals. Also, we do not exclude the possibility that a large period of training could be more effective in reducing the body weight. Winding et al; noticed that high-intensity interval training after 11 weeks of intervention reduced body composition including fat mass, visceral fat mass, HbA1c and, consequently, the glucose levels in T2DM patients19. In this line, four different groups of individuals submitted to physical exercise with different volumes and different intensities were compared, and from these results, the authors suggested that the volume may be more important than the intensity when the main goal of the protocol is weight loss20. Donnelly and colleagues21 proposed that the amount of exercise required in order to reduce adiposity should be 200–300 minutes per week. However, exercise will not always lead to reduced body weight. Pontzer and colleagues22 showed in different populations that exercise can trigger reductions in basal energy expenditure leading to an effective energy control. These findings corroborate our study and enable us to provide evidence of why the trained group showed no significant weight loss. Also, an important point to highlight is the period of training. Here we trained the participants during 8 weeks.
The fact that the participants did not present a change in body weight makes the training protocol used even more effective in controlling hypercholesterolemia and hyperglycemia in diabetics. These results corroborate the systematic review of Bray et al.23, which emphasizes that even with no changes in the volume of adipose tissue, there is a possibility of physical exercise affecting the body directly and promoting benefits in terms of glucose homeostasis. Additionally, the authors suggest that training volumes of between 30 and 45 minutes per day should be undertaken to prevent obesity. Also, recently, our group reported that short-term training (fifteen days) was enough to decrease obesity-related lipogenesis and hepatic inflammation improving hepatic insulin sensitivity and glycaemia independent od weight loss in obese mice24. Taking all this information together, it is suggested that exercise may offer other benefits besides weight loss8. Therefore, it is stated that the training protocol proposed in this study is effective in controlling hyperglycemia in diabetic patients regardless of body weight change. Also, although we did not measure other metabolic health parameters, it is known that exercise can be a benefit for the whole body reducing chronic disease even if there is no weight-loss25.
The studies of Rivellese et al.26 and Matheus et al.27 have shown that heart disease is the leading cause of death in diabetic patients. Therefore the practice of physical exercise becomes important, because during exercise there is an increase in lipoprotein lipase activity and uptake of VLDL-c, promoting an increased level of HDL-c and decreasing LDL-c and TG28. The results of our research showed that the practice of planned exercise was not able to reduce levels of TG, VLDL-c and HDL-c. On the other hand, this protocol was effective in reducing LDL-c and total cholesterol levels. Among the fractions of total cholesterol, LDL-c has a fundamental role in the development of cardiometabolic diseases and has a strong correlation with mortality rates from cardiovascular disease29. Therefore, exercise protocols that reduce these lipoproteins are important for dyslipidemic participants. The present results on the serum lipid profile showed that 90 minutes of exercise weekly really does not promote all the same benefits generated by the practice of 150 minutes of regular physical exercise. However, 90 min/week of moderate exercise was effective in reducing the total cholesterol level and LDL-c, resulting in benefits for the cardiovascular health of diabetic individuals. This is important for a clinical prescription.
As regards the glycemic profile, it is known that regular exercise promotes metabolic control in diabetic patients, an important component in the treatment of DM211. In humans and animal models, aerobic training increases glucose uptake stimulated by insulin30,31 and decreases the secretion of insulin in response to elevated blood glucose levels32, thereby contributing to fine control of glycemia. The reduction in fasting hyperglycemia is linked to insulin sensitivity, mainly in the muscle and liver tissues, as these two tissues are responsible for about 60% of all glucose metabolism33. In this way, exercise can act on the liver, reducing gluconeogenesis 7, and on the muscle tissue, increasing glucose uptake34. Furthermore, many studies have shown the effects of exercise in controlling fasting glycemia regardless of changes in body weight35,36.
Conclusion
It was observed that 90 min/week of moderate exercise reduced fasting hyperglycemia. Firstly, it was observed that during exercise a reduction of hyperglycemia, compared to baseline levels, could be observed from the second exercise session. In addition, in basal state, the reduction of fasting glycaemia was observed after 4 weeks of training and also after comparing the trained participants with untrained at the end of the experiment, indicating the effectiveness of the proposed protocol. These findings can be helpful to the scientific community because they show that for glycemic control, 90 minutes weekly of moderate aerobic exercise can be applicable to T2DM participants.
Acknowledgments
The Unit Health Center II of Sumare/Sao Paulo-Brazil, for collaborating with the study and providing information about the diabetic population.
Declare of competing interest
The authors declare no conflict of interest.
Abbreviations
ACSM: American College of Sports Medicine; ADA: American Diabetes Association; AGE: Advanced Glycation End-product; BMI: Body mass index; DBP: Diastolic blood pressure; HbA1c: Glycated hemoglobin; HDL-c: High density lipoprotein cholesterol; HR: Heart rate; LDL-c: Low density lipoprotein cholesterol; MHR: Maximum heart rate; mmHg: millimeters of mercury; SBP: Systolic blood pressure; TG: Total triglycerides; T2DM: Type 2 Diabetes mellitus; VLDL-c: Very low density lipoprotein cholesterol; WHR: Waist / Hips ratio.
References
- Hallal PC, Andersen LB, Bull FC, et al. Global physical activity levels: surveillance progress, pitfalls, and prospects. Lancet. 2012;380:247-257, doi:10.1016/S0140-6736(12)60646-1.
- Jones DS, Podolsky SH, Greene JA. The burden of disease and the changing task of medicine. N Engl J Med. 2012;366:2333-2338, doi:10.1056/NEJMp1113569.
- Cho NH, Shaw JE, Karuranga S, et al. IDF Diabetes Atlas: Global estimates of diabetes prevalence for 2017 and projections for 2045. Diabetes Res Clin Pract. 2018;138:271-281, doi:10.1016/j.diabres.2018.02.023.
- Houstis N, Rosen ED, Lander ES. Reactive oxygen species have a causal role in multiple forms of insulin resistance. Nature. 2006;440:944-948, doi:10.1038/nature04634.
- Alexander GC, Sehgal NL, Moloney RM, et al. National trends in treatment of type 2 diabetes mellitus, 1994-2007. Arch Intern Med. 2008;168:2088-2094, doi:10.1001/archinte.168.19.2088.
- Nathan DM. Diabetes: Advances in Diagnosis and Treatment. JAMA. 2015;314:052-1062, doi:10.1001/jama.2015.9536.
- Bautista L, Reininger B, Gay JL, et al. Perceived barriers to exercise in Hispanic adults by level of activity. J Phys Act Health. 2011;8:916-925.
- de Moura LP, Pauli LSS, Cintra DE, et al. Acute exercise decreases PTP-1B protein level and improves insulin signaling in the liver of old rats. Immun Ageing. 2013;10:8, doi:10.1186/1742-4933-10-8.
- Hamasaki H. Daily physical activity and type 2 diabetes: A review. World J Diabetes. 2016;7:243-251, doi:10.4239/wjd.v7.i12.243.
- Balducci S, Sacchetti M, Haxhi J, et al. Physical exercise as therapy for type 2 diabetes mellitus. Diabetes Metab Res Rev 30 Suppl. 2014;1:13-23, doi:10.1002/dmrr.2514.
- Colberg SR, Sigal RJ, Fernhall B, et al. Exercise and type 2 diabetes: the American College of Sports Medicine and the American Diabetes Association: joint position statement. Diabetes Care. 2010;33:e147-167, doi:10.2337/dc10-9990.
- Tjonna AE, Leinan IM, Bartnes AT, et al. Low- and high-volume of intensive endurance training significantly improves maximal oxygen uptake after 10-weeks of training in healthy men. PLoS One. 2013;8:e65382, doi:10.1371/journal.pone.0065382.
- Gibala MJ, Gillen JB, Percival ME. Physiological and health-related adaptations to low-volume interval training: influences of nutrition and sex. Sports Med 44 Suppl. 2014;2:S127-137, doi:10.1007/s40279-014-0259-6.
- Damas F, Phillips SM, Lixandrao ME, et al. Early resistance training-induced increases in muscle cross-sectional area are concomitant with edema-induced muscle swelling. Eur J Appl Physiol. 2016;116:49-56, doi:10.1007/s00421-015-3243-4.
- Dipietro L, Campbell WW, Buchner DM, et al. Physical Activity, Injurious Falls, and Physical Function in Aging: An Umbrella Review. Med Sci Sports Exerc. 2019;51:1303-1313, doi:10.1249/mss.0000000000001942.
- KARVONEN MJ, KENTALA E, MUSTALA O. The effects of training on heart rate; a longitudinal study. Ann Med Exp Biol Fenn. 1957;35:307-315.
- Khavandi K, Amer H, Ibrahim B, et al. Strategies for preventing type 2 diabetes: an update for clinicians. Ther Adv Chronic Dis. 2013;4:242-261, doi:10.1177/2040622313494986.
- Davies MJ, D'Alessio DA, Fradkin J, et al. Management of Hyperglycemia in Type 2 Diabetes, 2018. A Consensus Report by the American Diabetes Association (ADA) and the European Association for the Study of Diabetes (EASD). Diabetes Care. 2018;41:2669-2701, doi:10.2337/dci18-0033.
- Winding KM, Munch GW, Iepsen UW, et al. The effect on glycaemic control of low-volume high-intensity interval training versus endurance training in individuals with type 2 diabetes. Diabetes Obes Metab. 2018;20:1131-1139, doi:10.1111/dom.13198.
- Jakicic JM, Marcus BH, Gallagher KI, et al. Effect of exercise duration and intensity on weight loss in overweight, sedentary women: a randomized trial. JAMA. 2003;290:1323-1330, doi:10.1001/jama.290.10.1323.
- Donnelly JE, Blair SN, Jakicic JM, et al. American College of Sports Medicine Position Stand. Appropriate physical activity intervention strategies for weight loss and prevention of weight regain for adults. Med Sci Sports Exerc. 2009;41:459-471, doi:10.1249/MSS.0b013e3181949333.
- Pontzer H, Durazo-Arvizu R, Dugas LR, et al. Constrained Total Energy Expenditure and Metabolic Adaptation to Physical Activity in Adult Humans. Curr Biol. 2016;26:410-417, doi:10.1016/j.cub.2015.12.046.
- Bray GA, Fruhbeck G, Ryan DH, et al. Management of obesity. Lancet. 2016, doi:10.1016/S0140-6736(16)00271-3.
- Pereira RM, da Cruz Rodrigues KC, Anaruma CP, et al. Short-term strength training reduces gluconeogenesis and NAFLD in obese mice. J Endocrinol. 2019;241:59-70, doi:10.1530/JOE-18-0567.
- Pedersen BK, Saltin B. Exercise as medicine - evidence for prescribing exercise as therapy in 26 different chronic diseases. Scand J Med Sci Sports 25 Suppl. 2015;3:1-72, doi:10.1111/sms.12581.
- Rivellese AA, Riccardi G, Vaccaro O. Cardiovascular risk in women with diabetes. Nutr Metab Cardiovasc Dis. 2010;20:474-480, doi:10.1016/j.numecd.2010.01.008.
- de Mattos Matheus AD, Tannus LRM, Cobas RA, et al. Impact of diabetes on cardiovascular disease: an update. Int J Hypertens. 2013;2013:653789, doi:10.1155/2013/653789.
- Kiens B, Lithell H. Lipoprotein metabolism influenced by training-induced changes in human skeletal muscle. J Clin Invest. 1989;83:558-564, doi:10.1172/JCI113918.
- Bo Zhang, Kawachi E, Miura SI, et al. Therapeutic approaches to the regulation of metabolism of high-density lipoprotein. Novel HDL-directed pharmacological intervention and exercise. Circ J. 2013;77:2651-2663.
- Aronson D, Violan MA, Dufresne SD, et al. Exercise stimulates the mitogen-activated protein kinase pathway in human skeletal muscle. J Clin Invest. 1997;99:1251-1257, doi:10.1172/JCI119282.
- Hardin DS, Azzarelli B, Edwards J, et al. Mechanisms of enhanced insulin sensitivity in endurance-trained athletes: effects on blood flow and differential expression of GLUT 4 in skeletal muscles. J Clin Endocrinol Metab. 1995;80:2437-2446, doi:10.1210/jcem.80.8.7629239.
- Hellenius ML, Brismar KE, Berglund BH, et al. Effects on glucose tolerance, insulin secretion, insulin-like growth factor 1 and its binding protein, IGFBP-1, in a randomized controlled diet and exercise study in healthy, middle-aged men. J Intern Med. 1995;238:121-130.
- Kowalski GM, Bruce CR. The regulation of glucose metabolism: implications and considerations for the assessment of glucose homeostasis in rodents. Am J Physiol Endocrinol Metab. 2014;307:E859-871, doi:10.1152/ajpendo.00165.2014.
- Oliveira NRC, Marques SO, Luciano TF, et al. Treadmill training increases SIRT-1 and PGC-1 α protein levels and AMPK phosphorylation in quadriceps of middle-aged rats in an intensity-dependent manner. Mediators Inflamm. 2014;2014:987017, doi:10.1155/2014/987017.
- Egger A, Niederseer D, Diem G, et al. Different types of resistance training in type 2 diabetes mellitus: effects on glycaemic control, muscle mass and strength. Eur J Prev Cardiol. 2013;20:1051-1060, doi:10.1177/2047487312450132.
- Van Dijk JW, Manders RJF, Canfora EE, et al. Exercise and 24-h glycemic control: equal effects for all type 2 diabetes patients? Med Sci Sports Exerc. 2013;45:628-635, doi:10.1249/MSS.0b013e31827ad8b4.
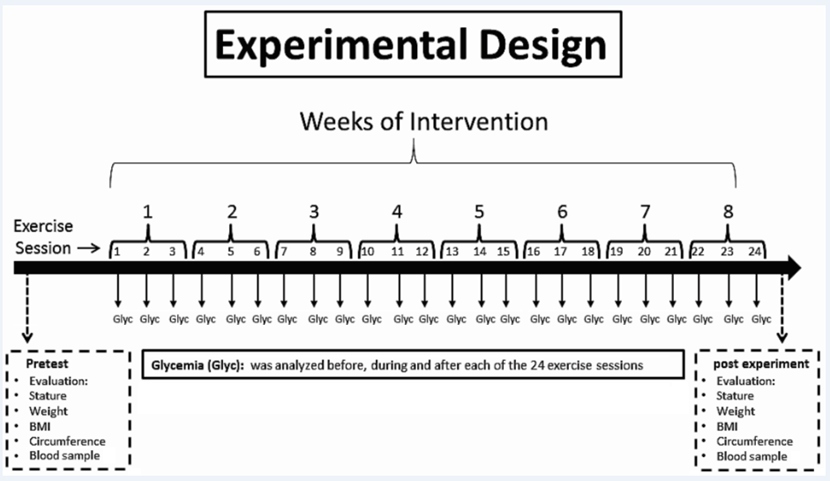
Supplementary Figure 1. Study’s experimental design. This illustration displays variables collected in the period before initiating the experimental protocol (pretest), such as stature, weight, BMI, circumference and blood samples; the blood glucose collected before, during and after each exercise session; and the variables that were collected at the end of the experiment, after eight weeks of training (post training), such as stature, weight, BMI, circumference and blood samples can be found.
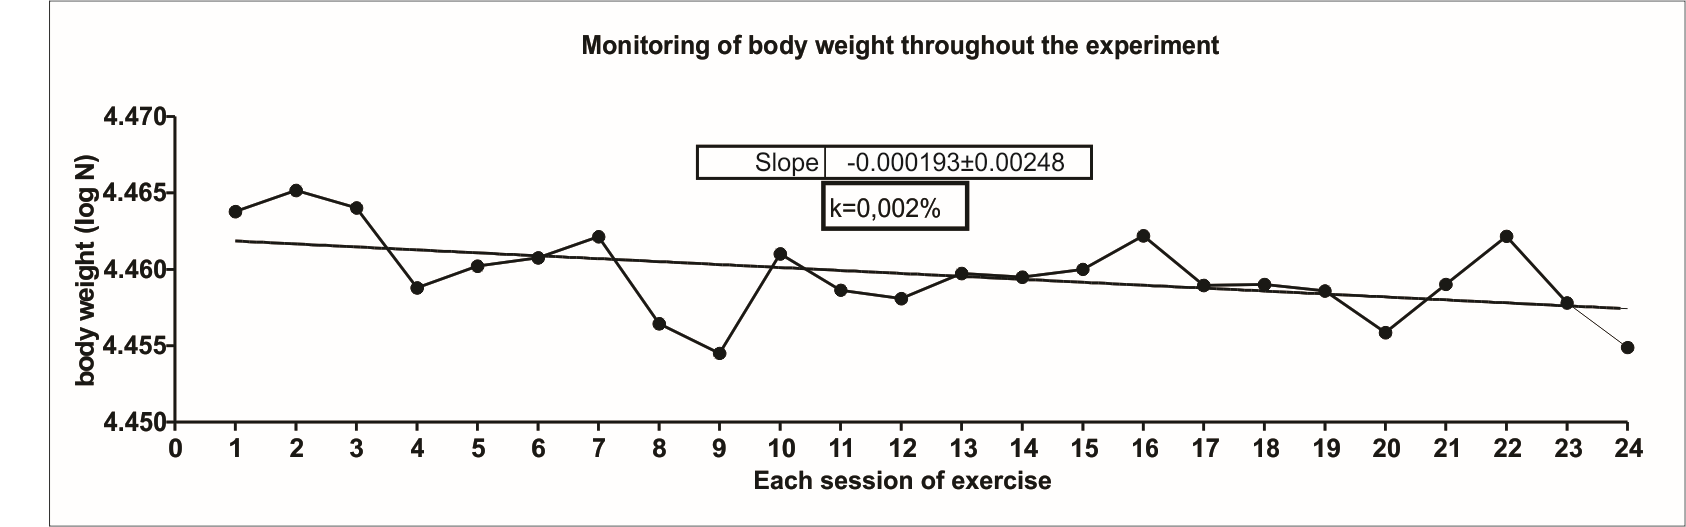
Supplementary Figure 2. Monitoring of body weight during whole experiment. All participants were weighed before each exercise session. The results were analyzed by calculating the body weight decay trend curve (k angle). The k angle was calculated by the formula (0.0693/t1/2) × 100 and expressed in %. The t1/2 was calculated by curve least squares analysis of body weight measured during the whole experiment using Microsoft Excel software 2007.
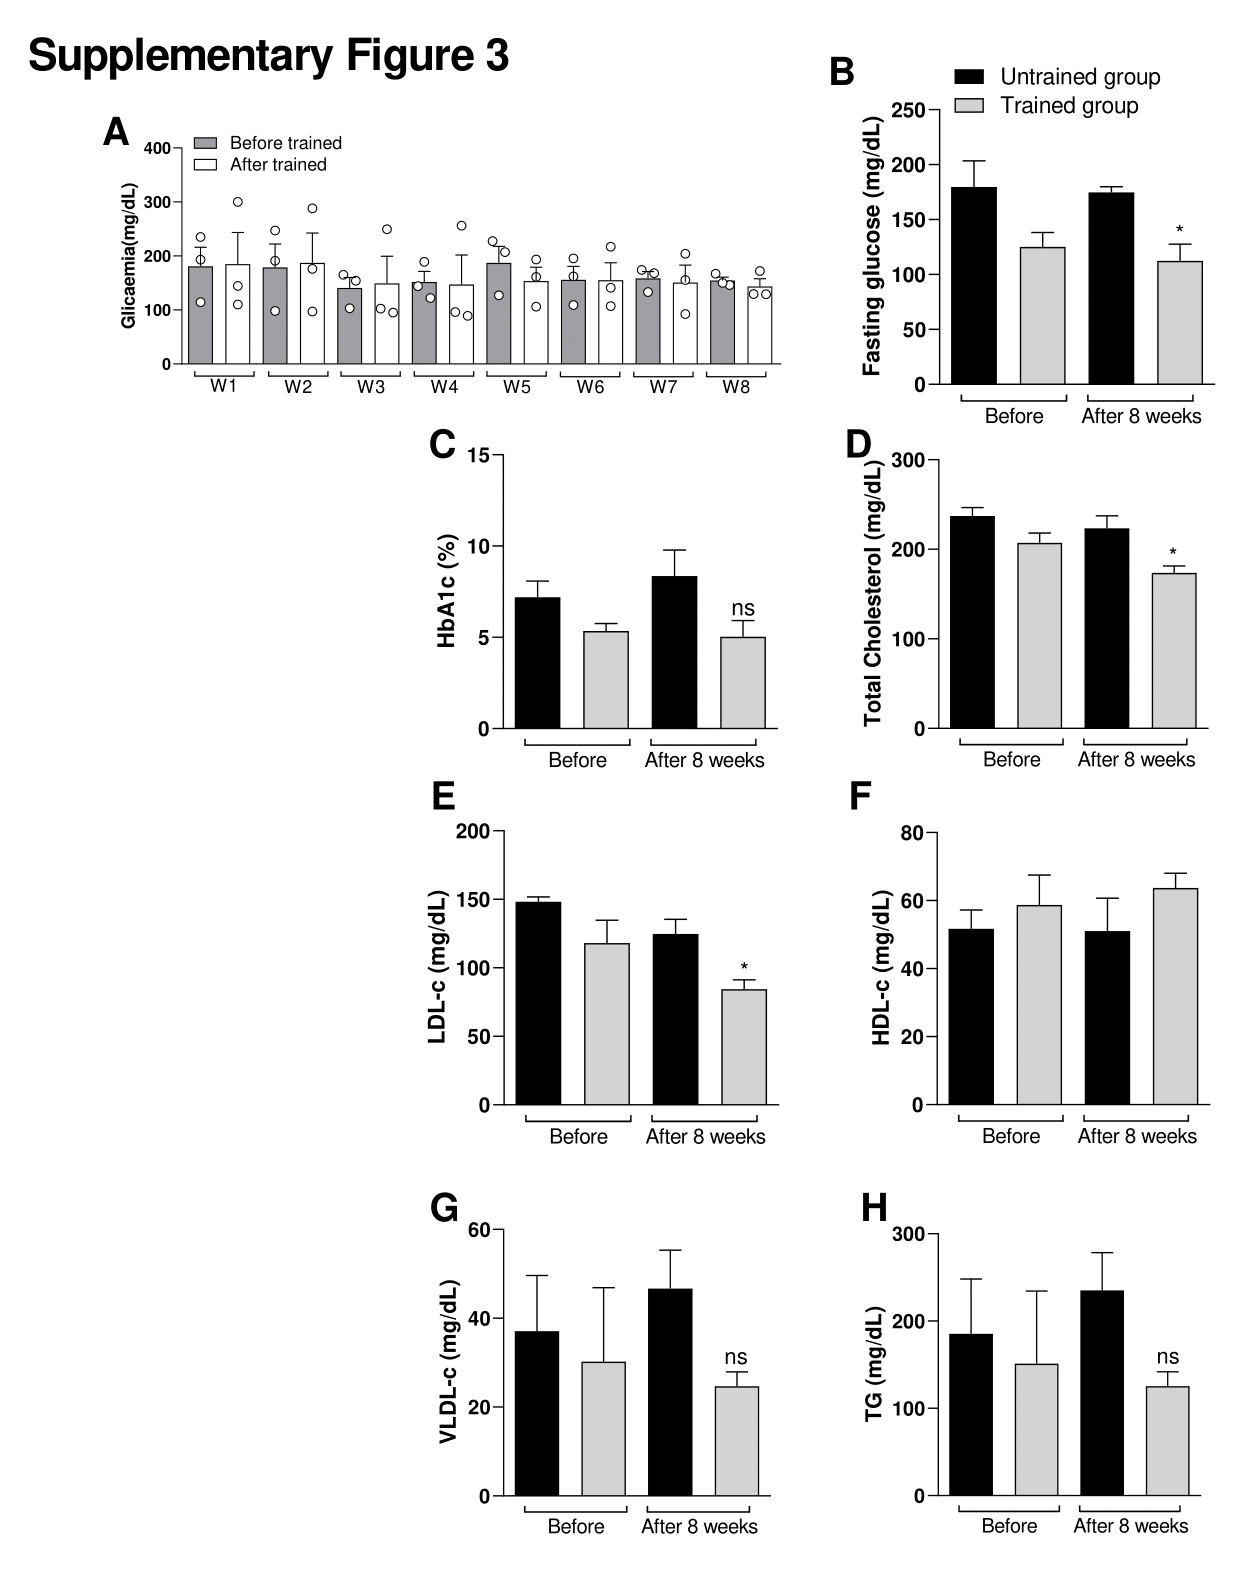
Supplementary Figure 3. Effect of exercise protocol in glycaemia between men. Effects of exercise on glucose levels. (A) Figure A shows the glycaemia before starting the exercise session (15 min before in rest state) and after each exercise session (15 min after exercise session). W = Week. Figure (B) shows the fasting glucose, (C) Glycated hemoglobin (HbA1c), (D) Total cholesterol, (E) Low density lipoprotein cholesterol (LDL-c), (F) HDL-c (High density lipoprotein cholesterol), (G) Very low-density lipoprotein cholesterol (VLDL-c) and (H) Total triglycerides (TG). Comparative between Untrained control group vs Trained group before and after the last week of training. Data were expressed using two-way ANOVA as mean ± S.E.M. using p<0.05. *means different from the first (W1) week (Before) of glycemia level (Related Fig S3A). *<0.05 vs. Untrained group. Data were expressed using Student’s t-test as mean ± S.E.M. using p<0.05. *means (related Fig S3 B-H).
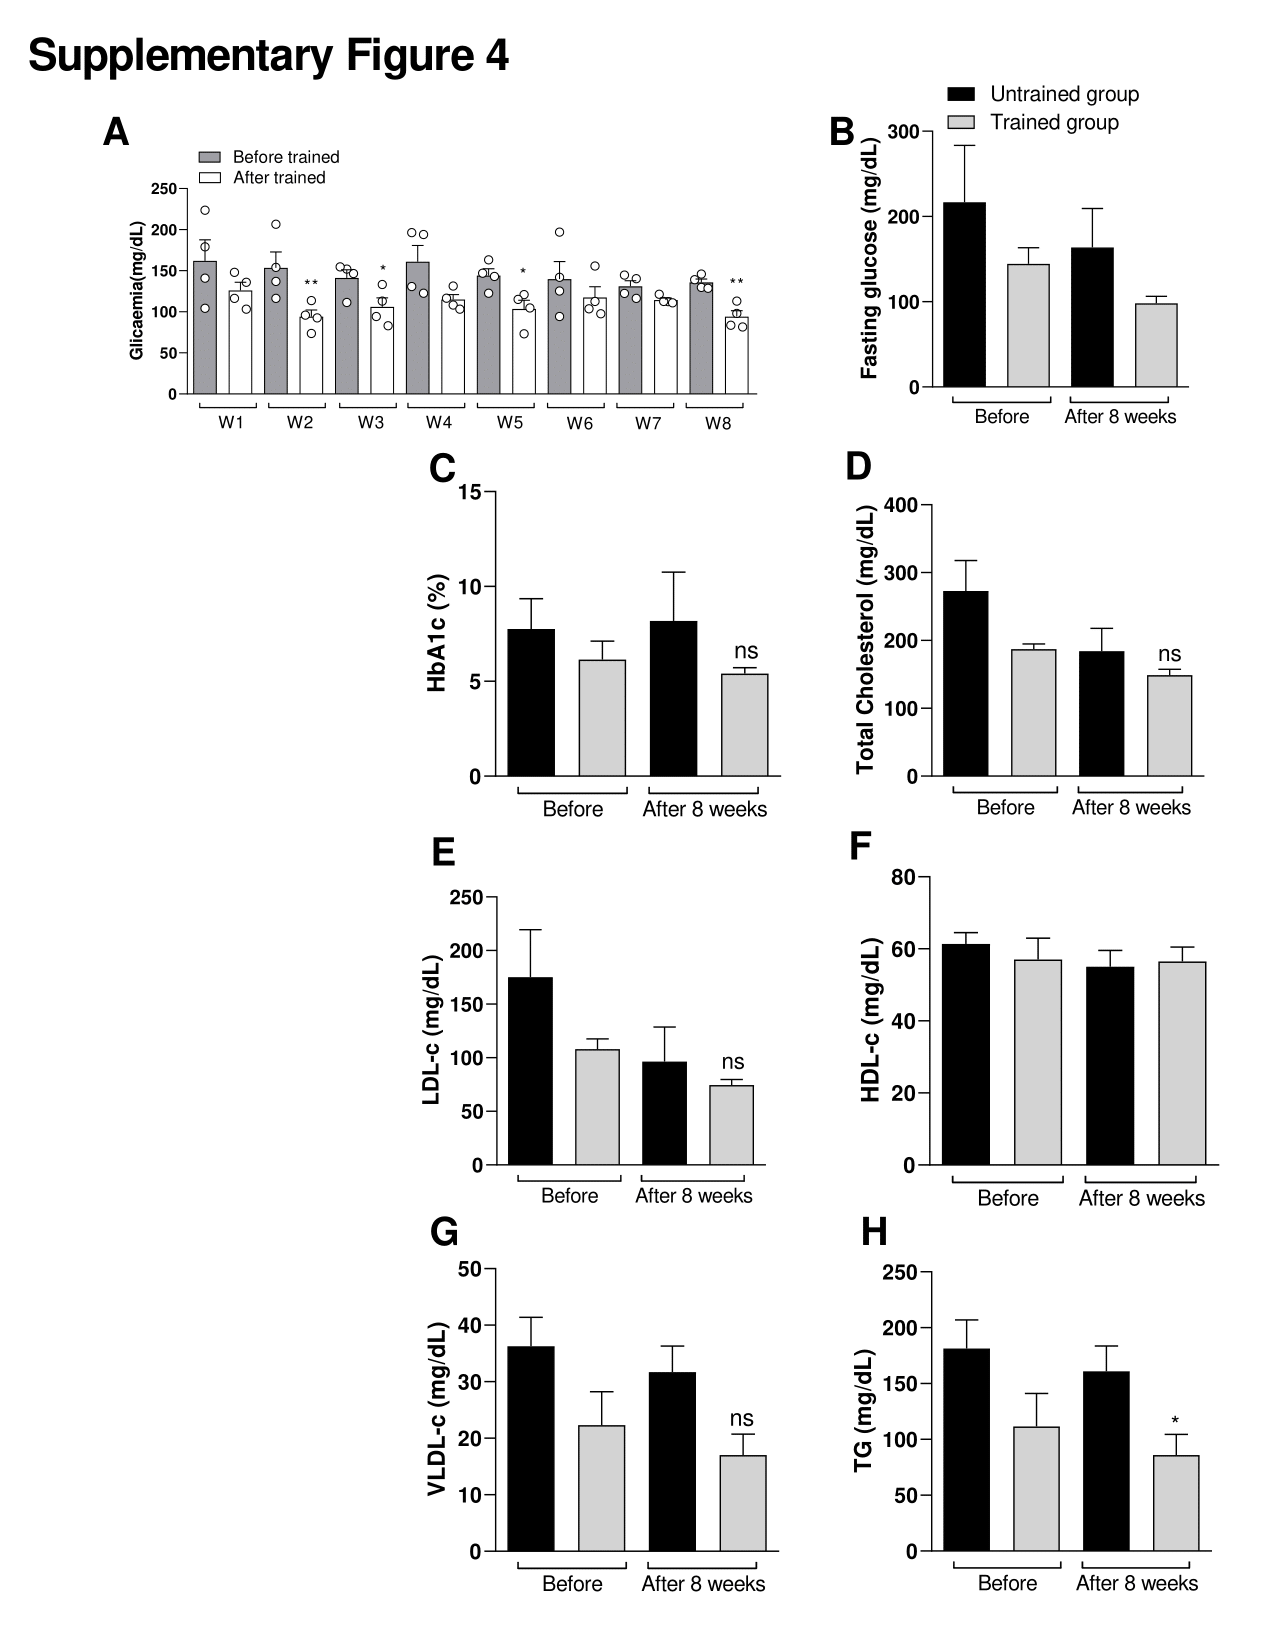
Supplementary Figure 4. Effect of exercise protocol in glycaemia between women. Effect of exercise protocol in glycaemia between men. Effects of exercise on glucose levels. (A) Figure A shows the glycaemia before starting the exercise session (15 min before in rest state) and after each exercise session (15 min after exercise session). W = Week. Figure (B) shows the fasting glucose, (C) Glycated hemoglobin (HbA1c), (D) Total cholesterol, (E) Low density lipoprotein cholesterol (LDL-c), (F) HDL-c (High density lipoprotein cholesterol), (G) Very low-density lipoprotein cholesterol (VLDL-c) and (H) Total triglycerides (TG). Comparative between Untrained control group vs Trained group before and after the last week of training. Data were expressed using two-way ANOVA as mean ± S.E.M. using p<0.05. *means different from the first (W1) week (Before) of glycemia level (Related Fig S3A). *<0.05 vs. Untrained group. Data were expressed using Student’s t-test as mean ± S.E.M. using p<0.05. *means (related Fig S3 B-H).
Supplementary Table 1. Demographic and anthropometric characteristics of Untrained or Trained diabetic patients.
|
|
Untrained group (n=6) |
Trained group (n=7) |
||||
|
1-Week |
8-week |
P value |
1-Week |
8-week |
P value |
|
|
Sex (M/F) |
2/4 |
- |
- |
3/4 |
- |
- |
|
Age |
49.8 |
- |
- |
45.3±3.9 |
- |
- |
|
Height (m) |
1.61 |
- |
- |
1.63±0.1 |
- |
- |
|
Body weight (kg) |
87.05±14.4 |
87.25±14.5 |
0.9813 |
89.09±22.0 |
88.33±22.7 |
0.475 |
|
BMI (kg/m2) |
33.38±4.3 |
33.44±41 |
0.9814 |
33.44±8.6 |
33.17±8.6 |
0,477 |
|
Waist (cm) |
101.08±7.3 |
101.42±8.5 |
0.9434 |
95.57±14.0 |
95.86±13.3 |
0.485 |
|
Hips (cm) |
110.75±15.0 |
110.5±14.1 |
0.9768 |
112.21±20.0 |
112.14±19.3 |
0.497 |
|
WHR (Waist/Hips ratio) |
0.92±0.1 |
0.93±0.1 |
0.9768 |
0.85±0.1 |
0.86±0.09 |
0.369 |